Hi there,
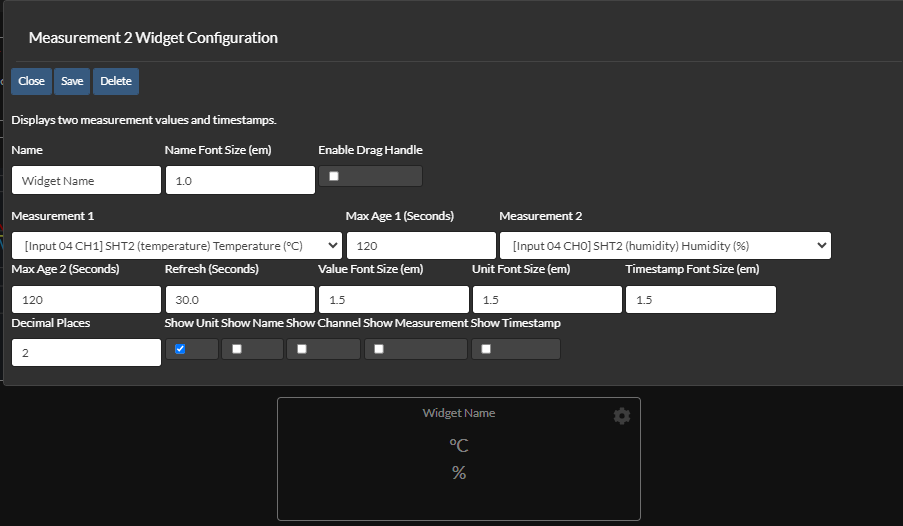
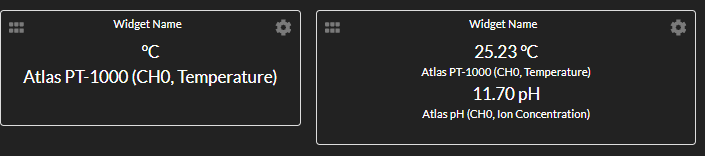
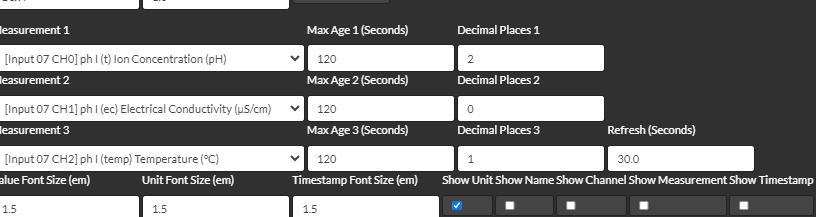
I’m trying to adjust the measurement widget to accommodate 2 or 3 measurements, however, since coding is not my strenght I’m using chatgpt. So far the custom widget is imported successfuly, it has fields for the measurements etc, however it does not show the values:
Hi Kyle,
thanks for taking the time to look in to this!
Upgraded to master, after a nginx 403 forbidden error and restarting the flask service it works as expected.
Just to confirm - if I want to create a 3 measurement widget should I just edit the code in custom file, or there are other changes that needs to be done elsewhere?
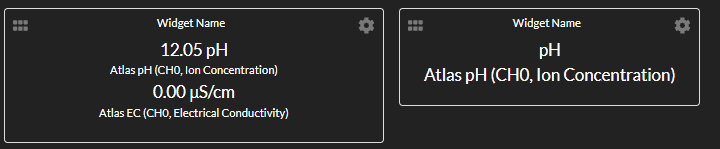
edit: it seems the 1 value widgets are somewhat broken - the same input which is visualized in 2-value does not show up
I’ll look into the single measurement widget. Does that issue only present itself when both widgets are on a dashboard, or does the single measurement widget never work on your system? The more information about replicating the issue, the better.
I wasn’t able to replicate the issue. Both widgets work as expected for me. If you can provide detailed steps to replicate the issue, I’ll investigate further.
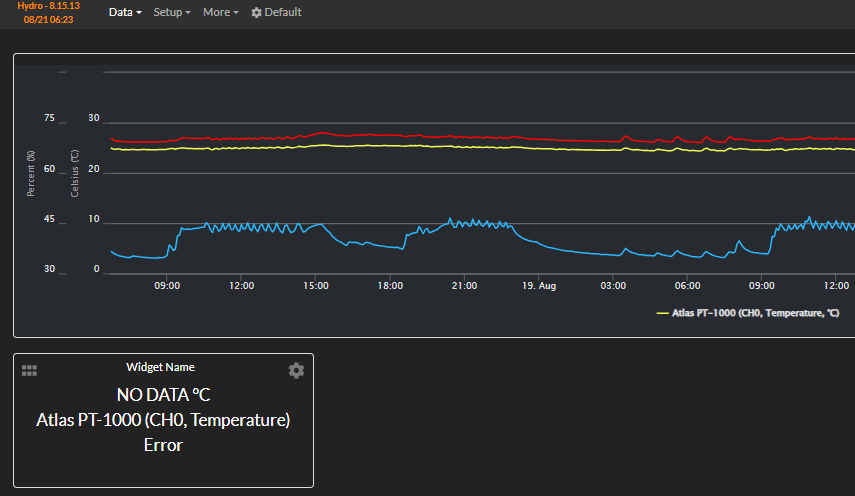
After deleting all the old widgets (created prior to upgrade to master) the new 1-v widgets started working. However for some reason the daemon status is lost and nothing is to be found in logs (it’s not a restart i guess)
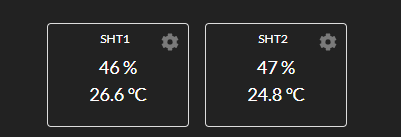
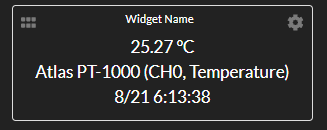
Anyway, created another dashboard and 1-v widgets are working
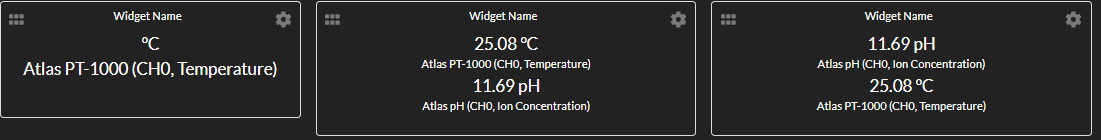
After adding 2-v widget with same measurement the 1-v stops visualizing data:
After removing the 1-v everything works as expected.
Anyway, i’ll delete all graphs etc later and recreate it to see if the graph could be causing it.
If there are any logs that could be of use to you?
Strange enough I couldn’t replicate it several days ago. Perhaps i didn’t do the exact same thing.
Anyway,happy to hear you found it.
For anyone interested attached is the code for 3 measurement custom widget.