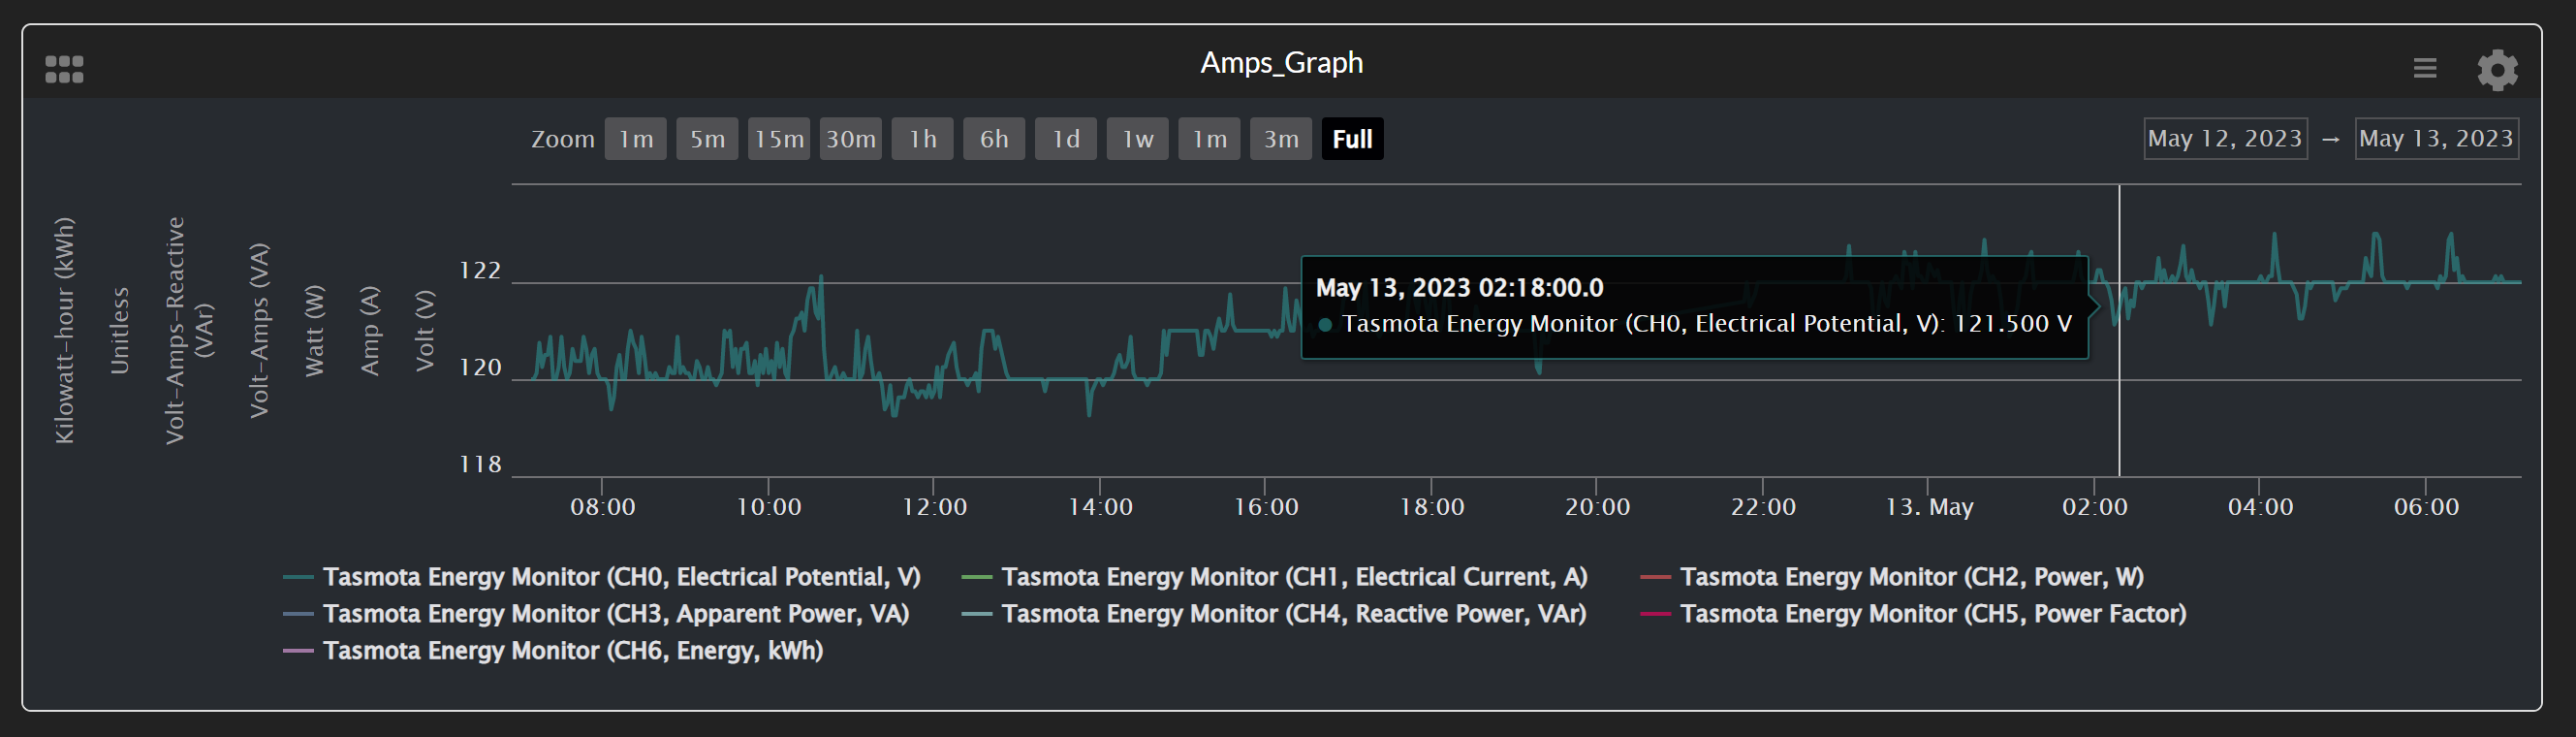
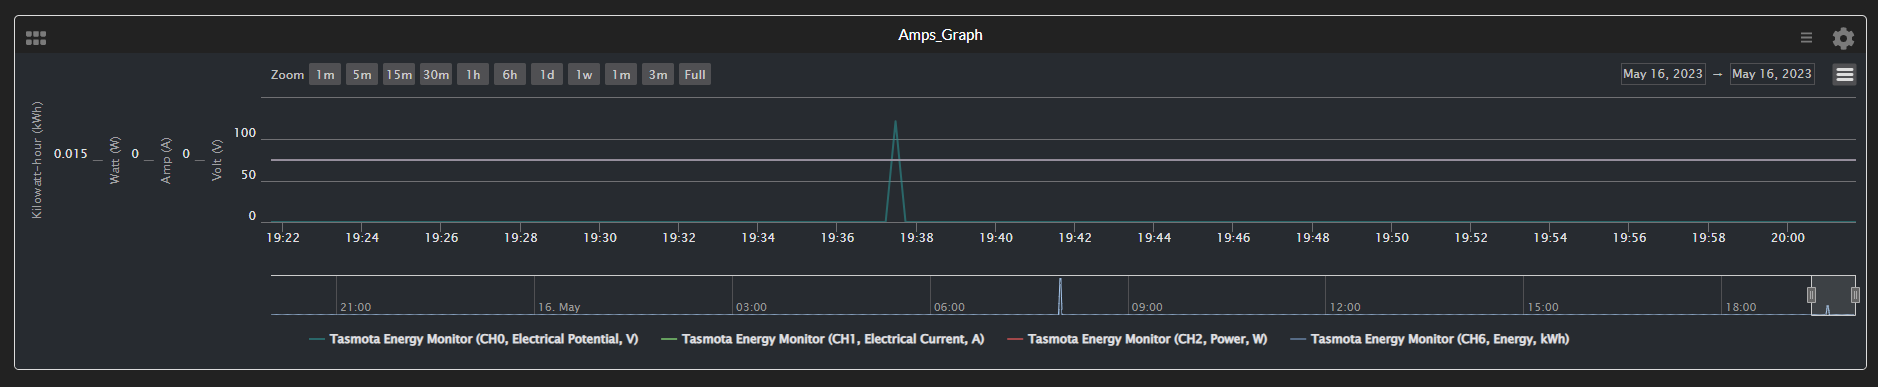
When going back to the associated graph. (Amps_Graph in below example) hover over pen details screen works for the first 5 seconds after webpage refresh then then no longer hover to provide the pop up overlay that hovers around the mouse_cursor.
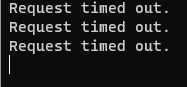
Well I think i’m having a hard time describing the error the more I’m testing the more I’m just finding oddities. I had planned to get a bit more screenshots but my R-Pi crashed thought i’d write this up while it reboots.
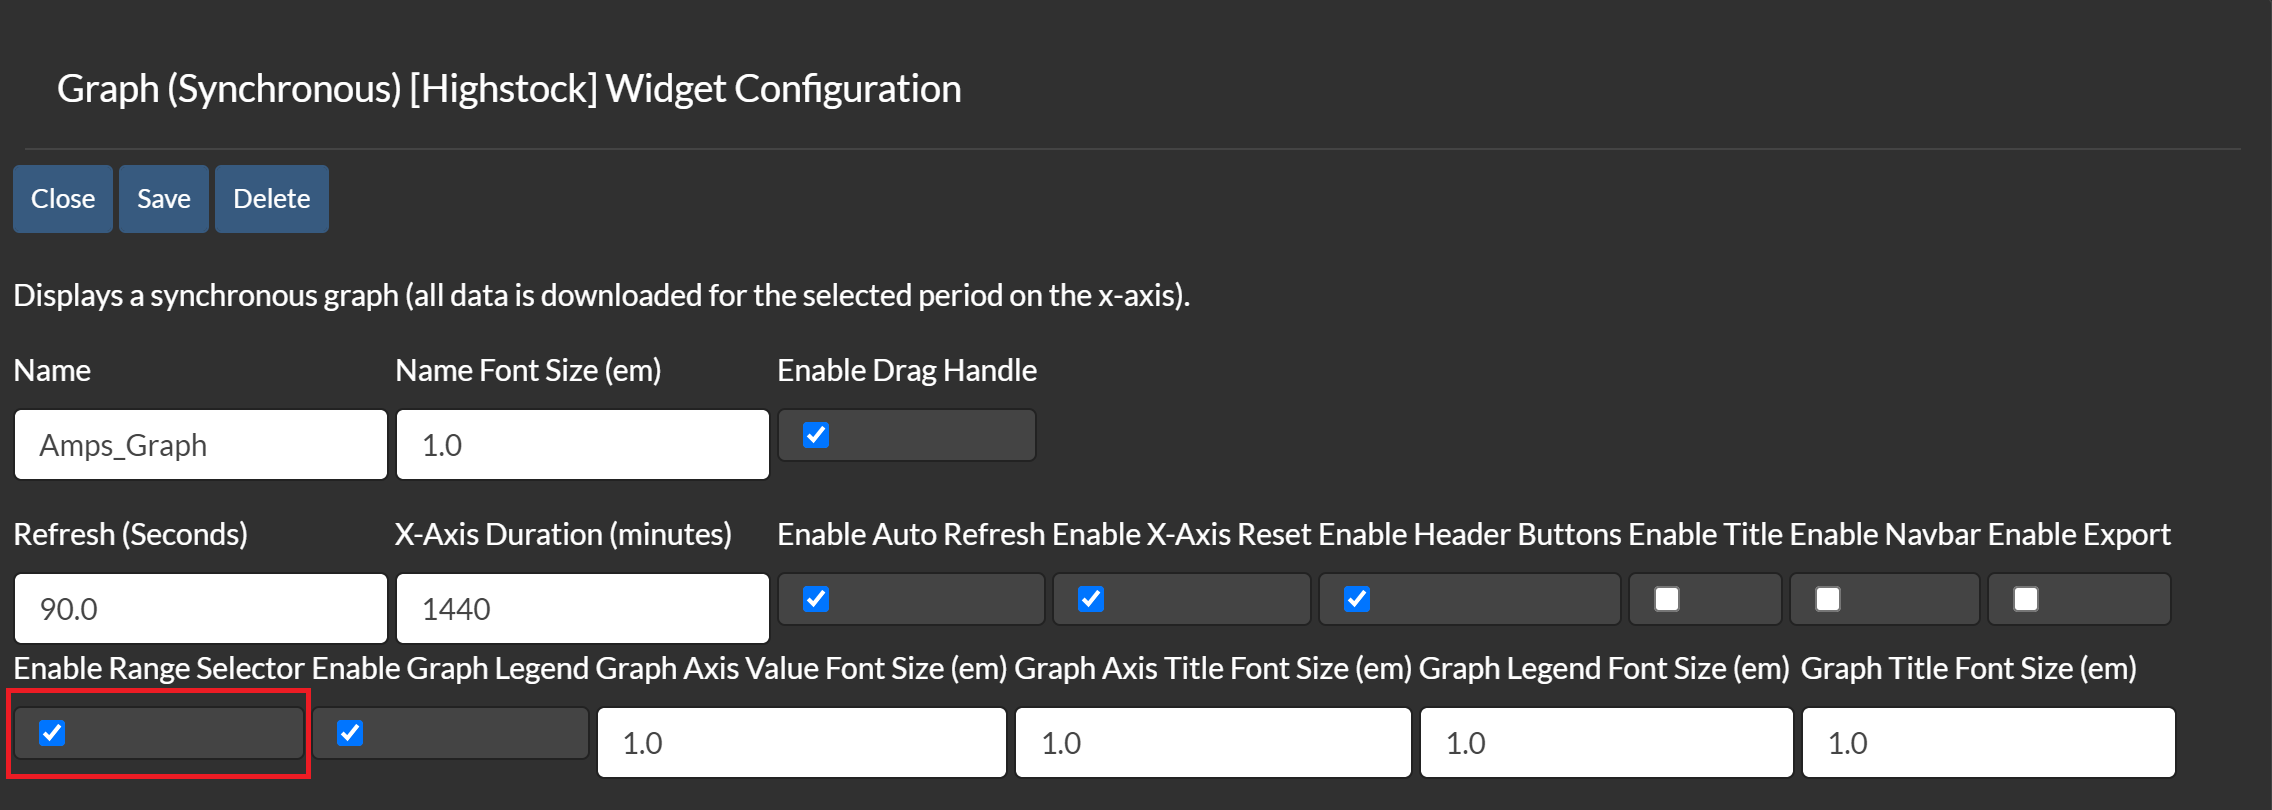
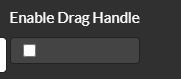
When Enable Range Selector is checked, On my install it seems the graph is buggy. I wonder if I have a dependency issue somewhere but I don’t know how to check. These use Grafana - https://grafana.com?
Also thought maybe its not a bug but my system is running out of resources somewhere due to zoom resolution buttons being more resource intensive but I really am grasping at straws this isn’t my expertise at all.
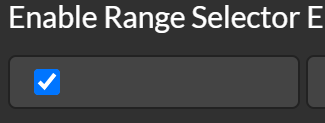
Unchecked 'Enable Range Selector
Clicked Save
Enabled Range selector
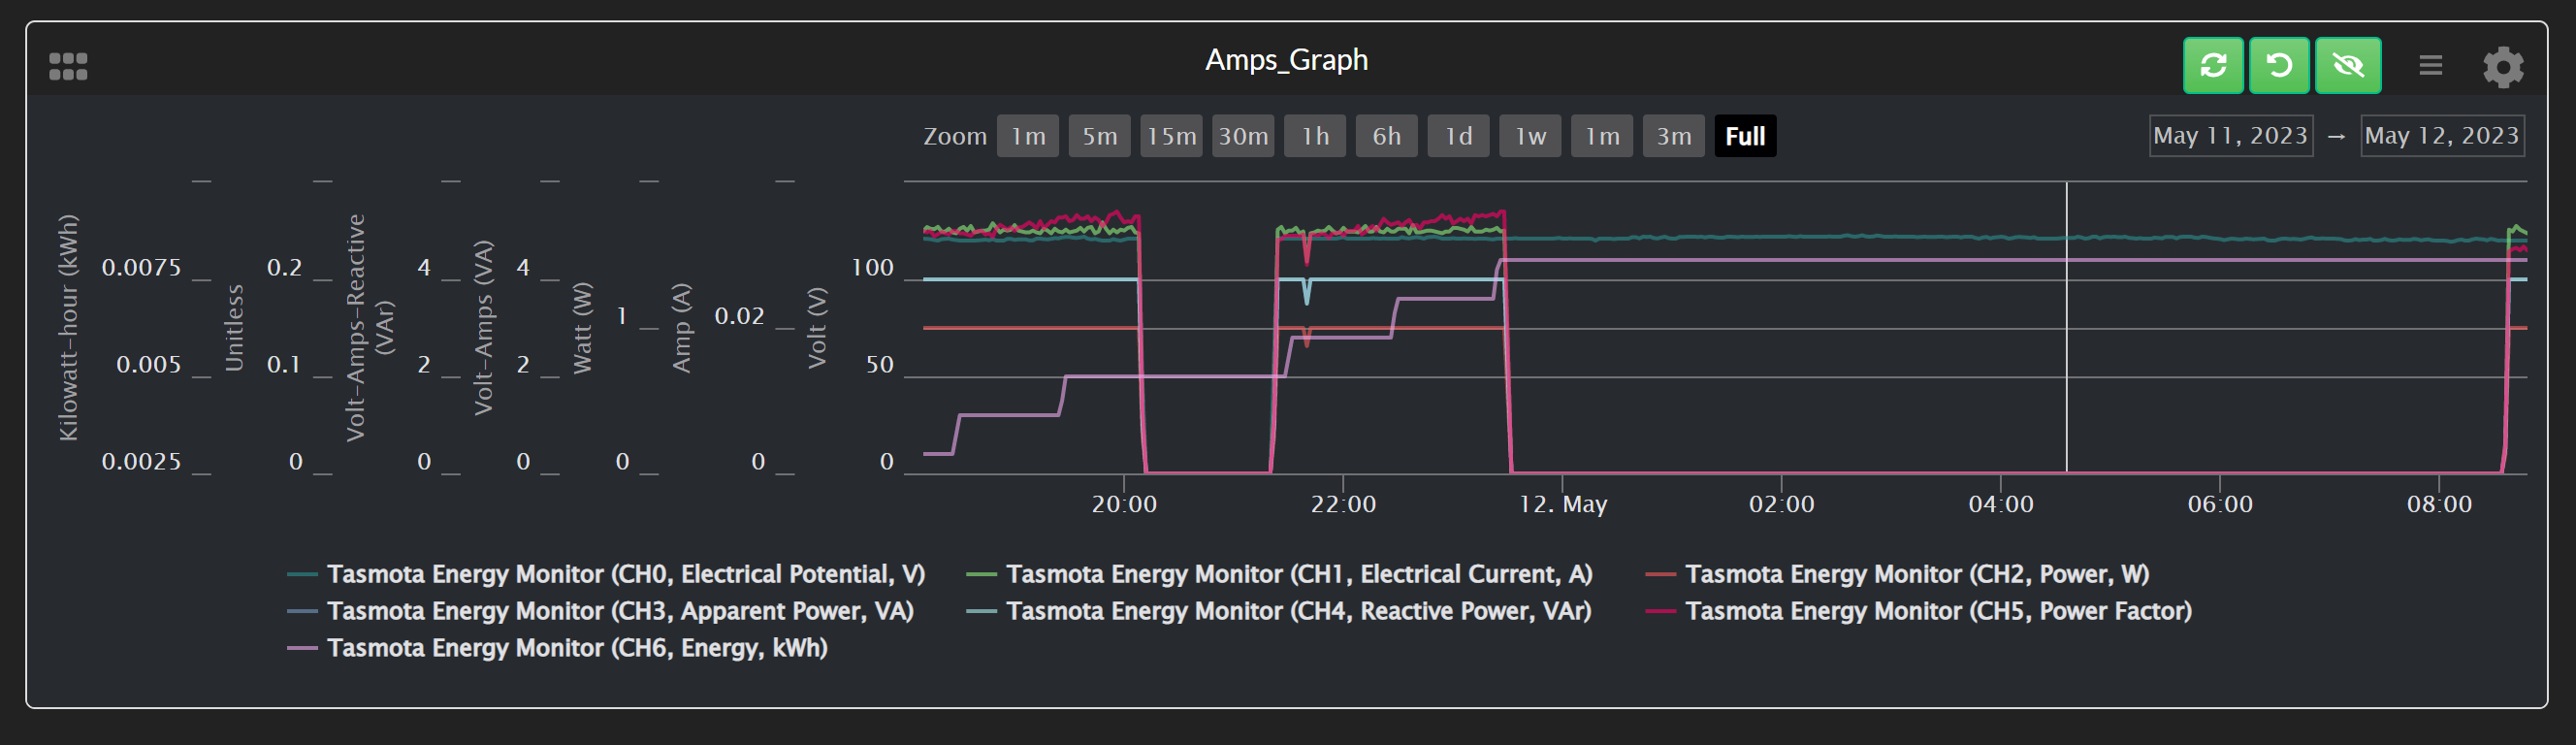
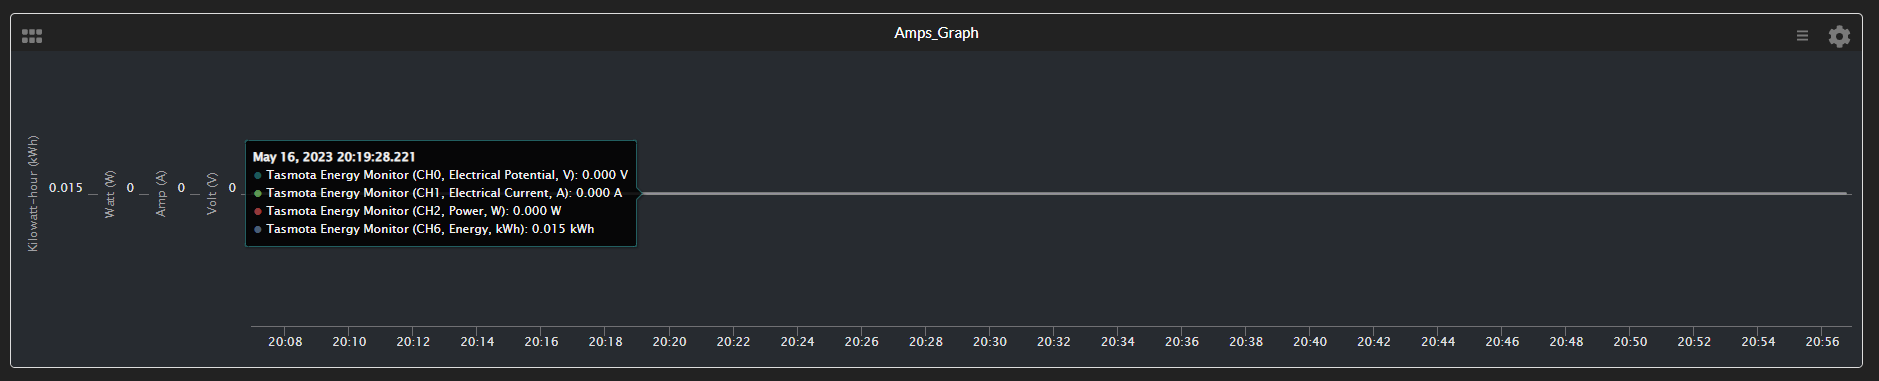
Grabbed a screenshot fast
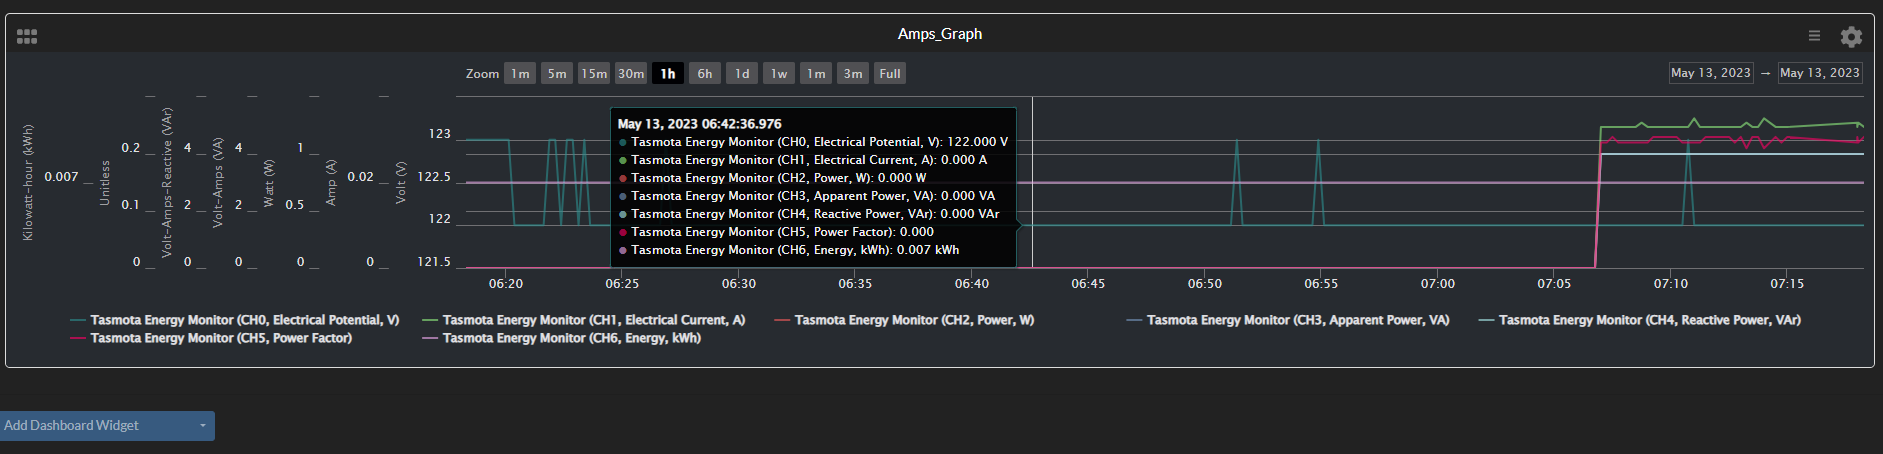
Only one pen populated this go around and Zoom buttons 1m-3m no longer are selectable but the single pen’s hover feature works.
Hover slider is working for all the pens in the trend and associated values appear to be populating with good data.
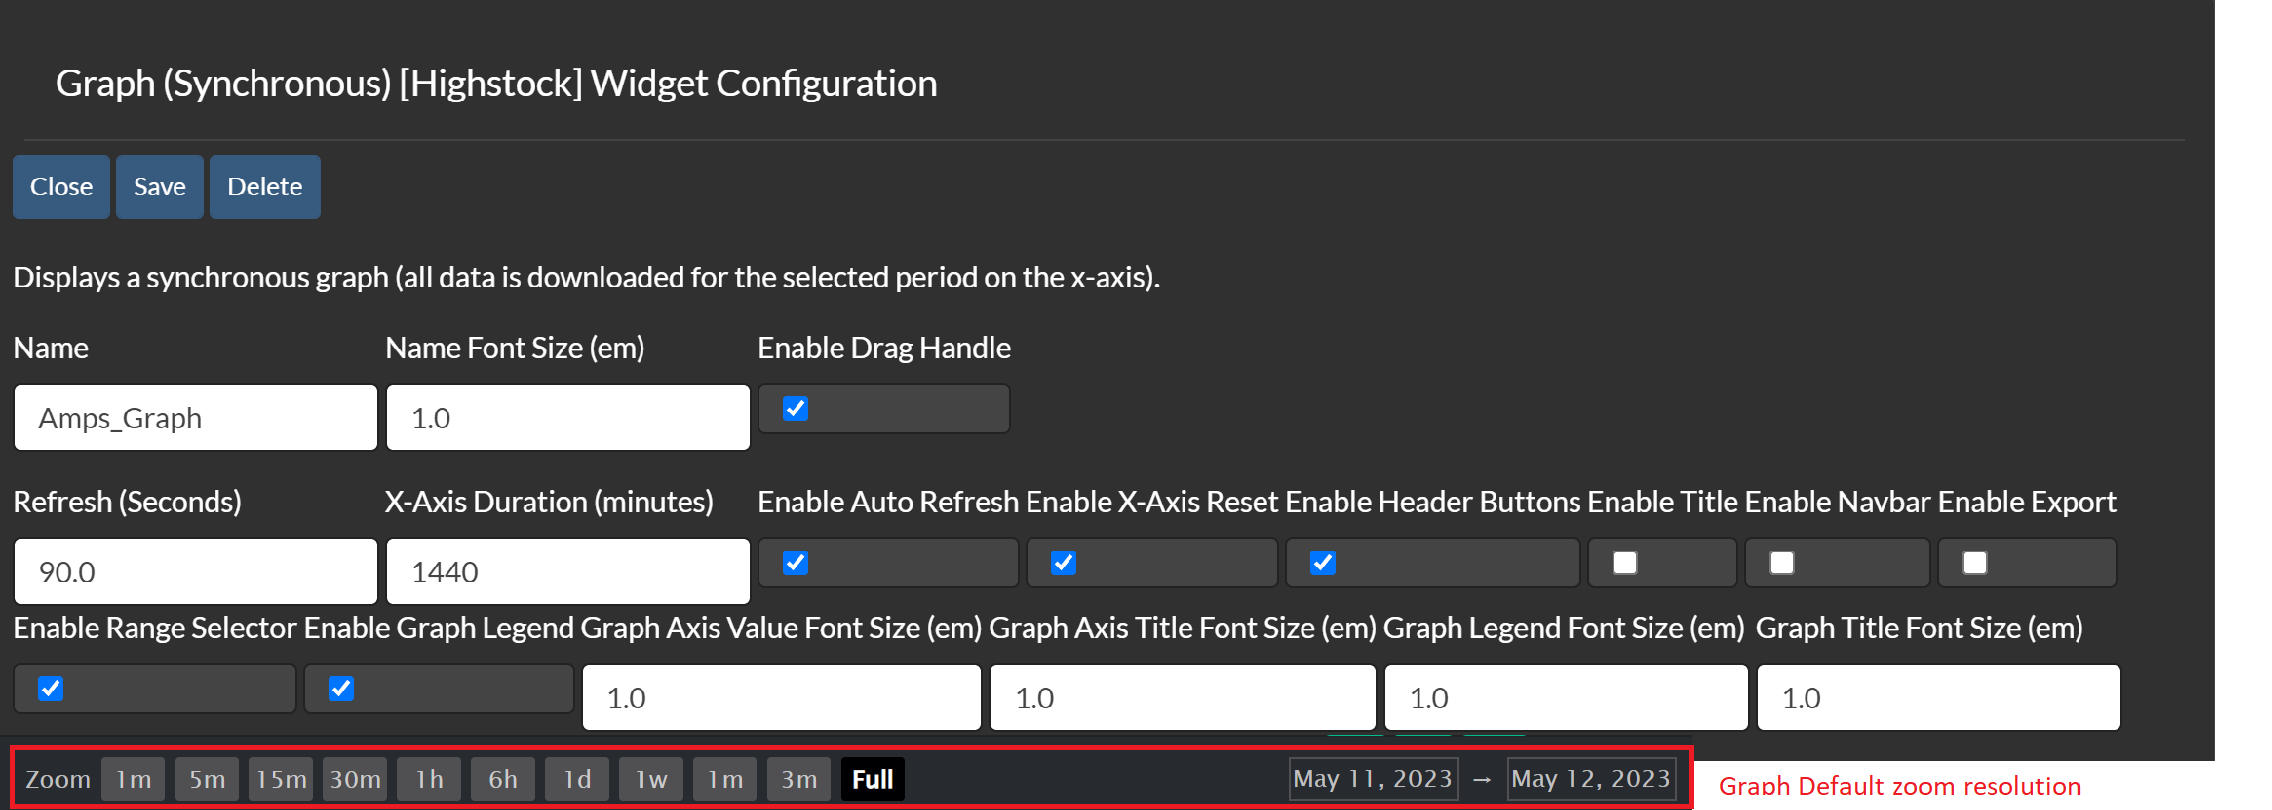
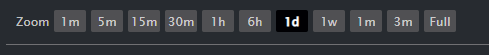
1m-1d: are select-able, that is to say that when the cursor hovers over them it changes to a hand icon and when you click the graph changes zoom level.
1w- Full: appear to be select-able, that is to say that when the cursor hovers over them it changes to a hand icon but when you click, the graph - it does not change zoom levels.