Hello, first Thanks Kyle. Amazing piece of software. The documentation and guides and hints and what not. Majestic, King Kyle!
However…
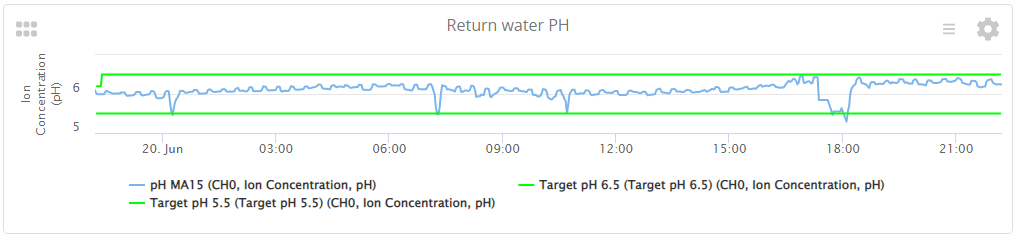
On the graphs, would it be possible to tag a specific value? Example below. I made this with a function. But it might be an easier way to do this for less stubborn people…
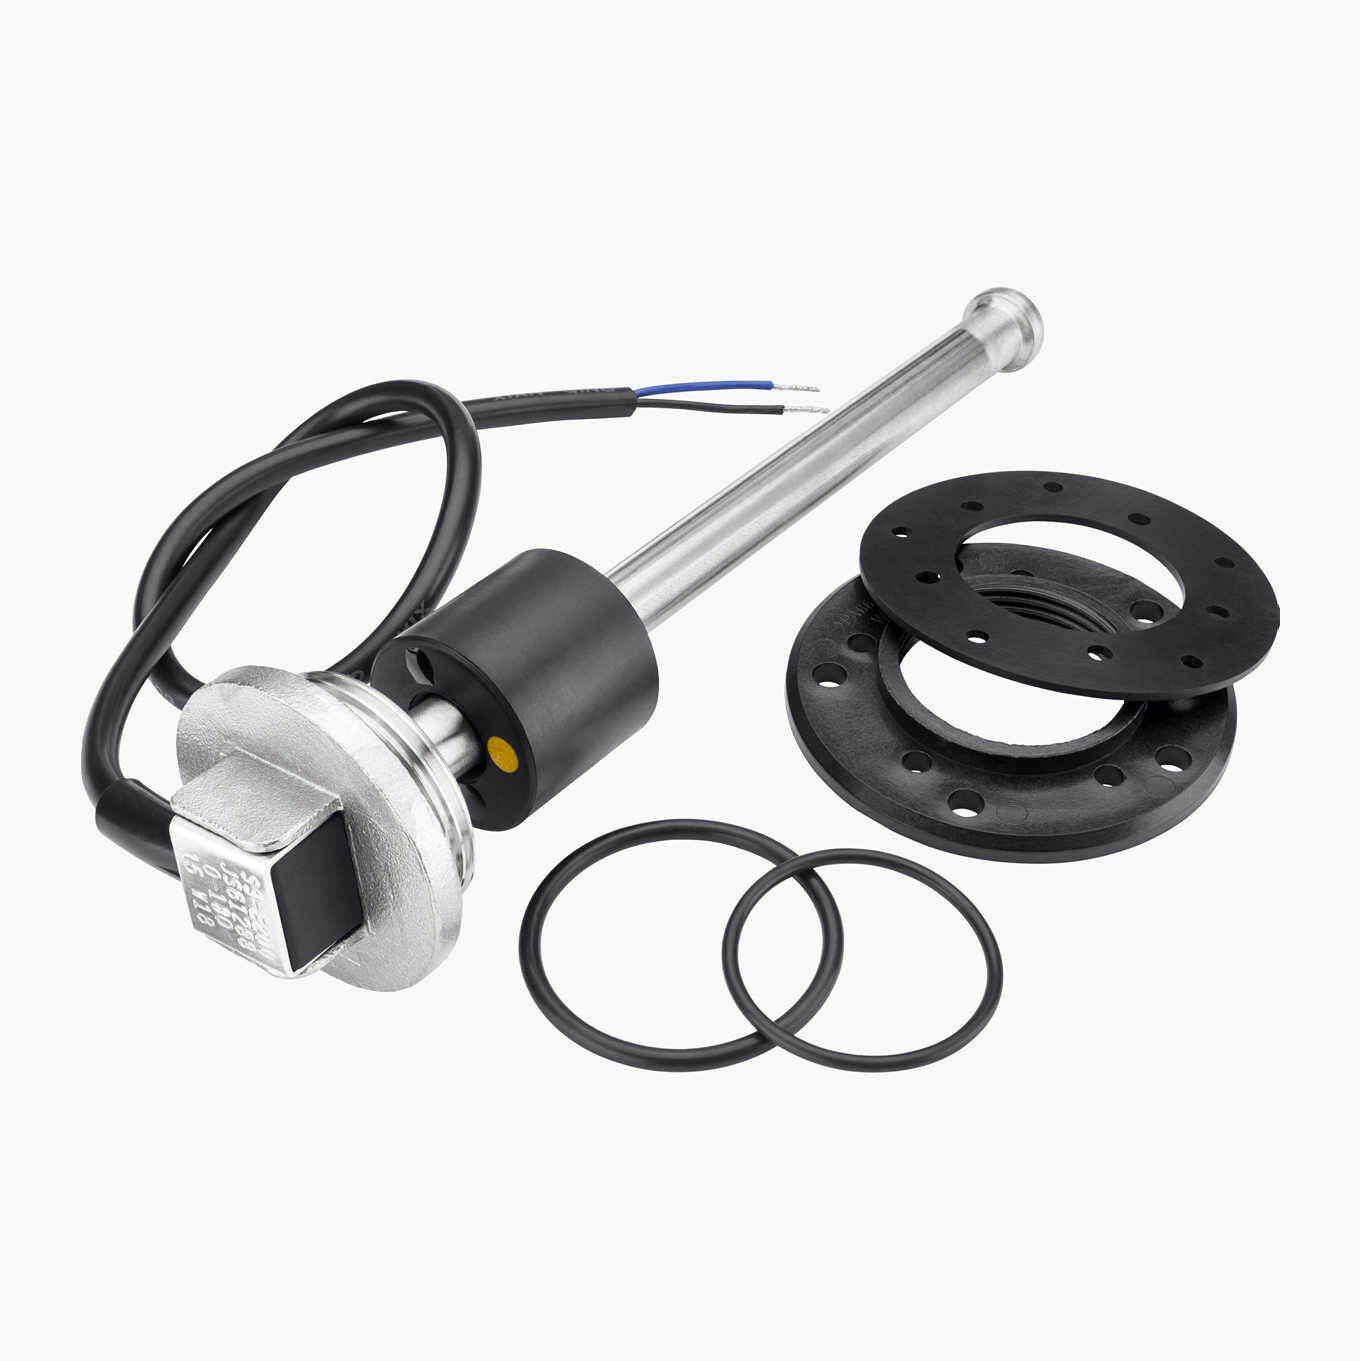
I made a function to handle it, but its fugly. 10+(x/2.311*100/3.333) 10 liters is the volume below indicator range. I run this on an adc1115 with some resistors and a 5v input, it ranges from 0.009 to 2.495v. Depending on water level/indicator. The stick has 0-180 ohm depending on location. Thus voltage changes if its measured between another set of resistors. It was a fiddle to figure the correct values out. It would simply be alot easier, if we could have a configuration page for it. “Bring the indicator to the bottom, and click the button [store value for low]. Bring the indicator to top, click button, collect value [store value for high]… How much water do you have while on low, vs on high?”
I had a third thing, but I lost it… Even if none of the above is of any interest. Still an amazing piece of software. Very well done. It really can’t be said enough times.
I remembered what I wanted, have anyone figured out how to use RSTP streams? I’ve tried all the libraries that exist, but can only find odd implementations or am I too much of a boomer to figure it out?
Do you mean you want to just have a periodic measurement at a specific value to display a horizontal line on a graph widget? The easiest way is to use an Equation Function and just put the value in the equation field.
What you describe would be a very complicated Input. There is already a similar Input that’s been developed by the community for measuring electrical conductivity and pH with the ads1115 and the ads1256 ADCs, which include calibration that sets certain values when the probe is inserted in calibration solutions. This type of calibration can be modified to do something similar for water elvel with this sensor. Taking these Inputs as a model, copying the file, then modifying it to suit your needs is probably the easiest way to acomplish what you’re trying to do.
I’m not familiar with RSTP and don’t have any network cameras to really develop the camera libraries beyond the wired cameras I use.
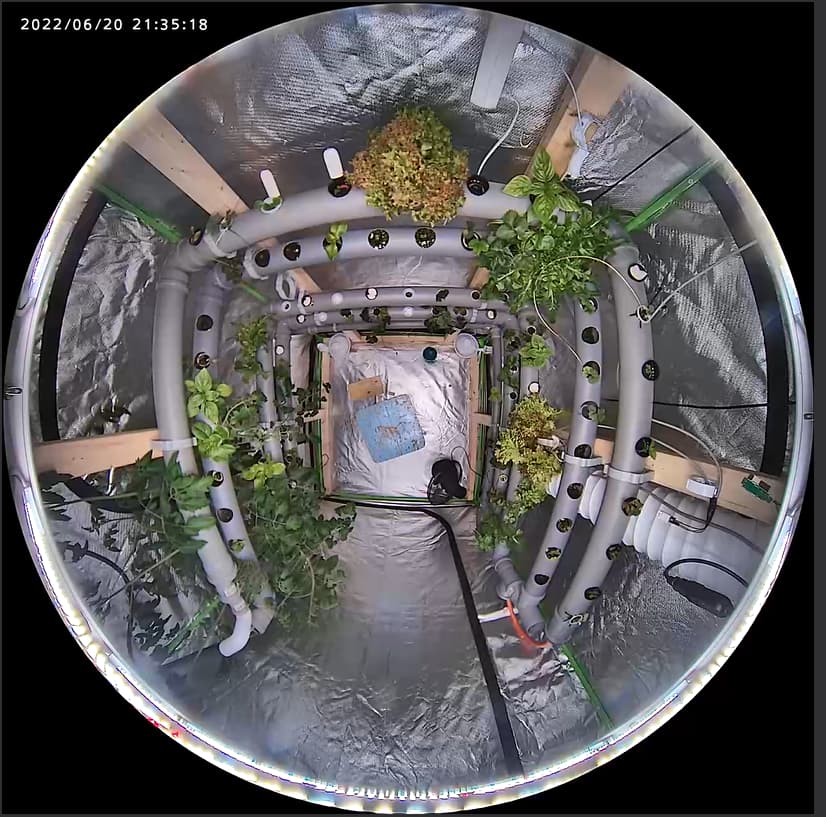
re: water level
On my ebb and flow (which is remote) I can tell from the pH and EC trends when the reservoir needs to be topped off and the levels need adjusted. No analog on a Pi without additional hardware but, you’ve got a ton of GPIO available so might a float switch work for what you need?