@KyleGabriel I was wondering whether the system keeps the log only for one day. If so, is there a way to enable all time logging/visualizing? Because, I can only access one day of data while observing the charts on dashboard.
Under Menue > Data > Asynchronous Graphs you can access “all data” that have been logged.
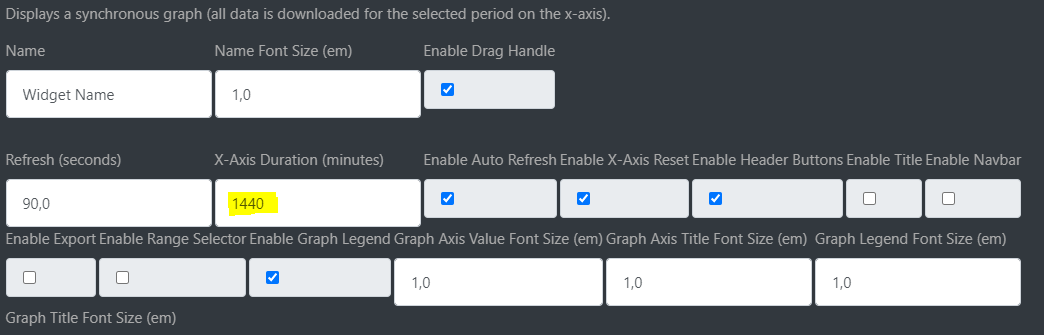
On the dashboard you can change the X-Axis Duration of the Graph Widget.
For statistical views you can use the [all data] function under Data > Asynchronous Graphs.
But as I understand, you want this function on the daily dashboard?