Hi! Thank you for an interesting project. I decided to try it for aging meat and salami.
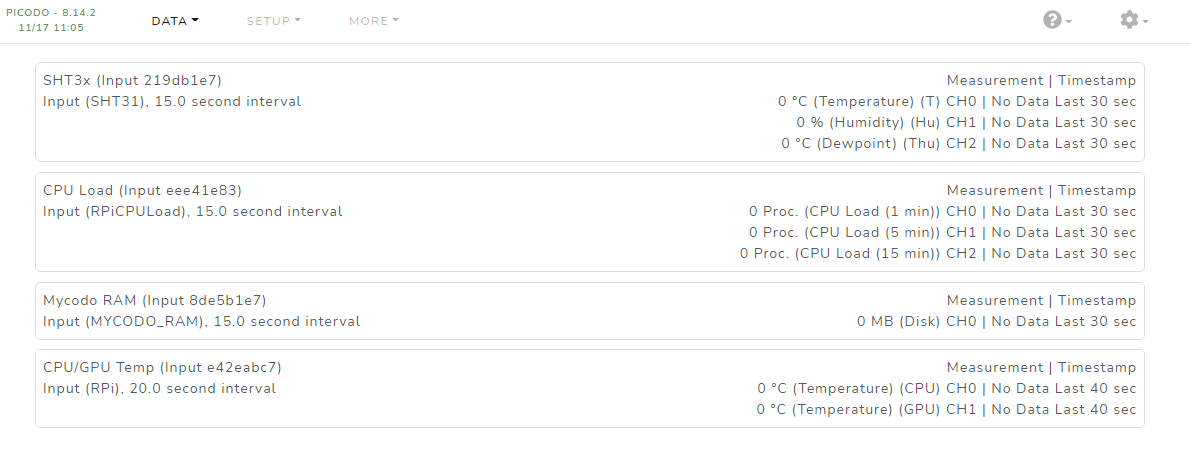
I made a clean Mycodo installation, connected the SHT3x sensor. Configured the input. There are measurements in the log. But Live measurements are not displayed - zero values. What am I doing wrong? Please tell me how to fix this? In logs no errors.
Log daemon:
2022-11-17 11:21:26,258 - DEBUG - mycodo.controllers.controller_input_219db1e7 - Adding measurements to InfluxDB with ID 219db1e7-da4a-4023-9d83-88b43b4ce2cf: {0: {'measurement': 'temperature', 'unit': 'C', 'value': 28.049515526054776, 'timestamp_utc': datetime.datetime(2022, 11, 17, 4, 21, 26, 244093)}, 1: {'measurement': 'humidity', 'unit': 'percent', 'value': 22.847333485923553, 'timestamp_utc': datetime.datetime(2022, 11, 17, 4, 21, 26, 244104)}, 2: {'measurement': 'dewpoint', 'unit': 'C', 'value': 4.873454036678941, 'timestamp_utc': datetime.datetime(2022, 11, 17, 4, 21, 26, 244167)}}
2022-11-17 11:21:41,266 - DEBUG - mycodo.controllers.controller_input_219db1e7 - Adding measurements to InfluxDB with ID 219db1e7-da4a-4023-9d83-88b43b4ce2cf: {0: {'measurement': 'temperature', 'unit': 'C', 'value': 28.06286717021439, 'timestamp_utc': datetime.datetime(2022, 11, 17, 4, 21, 41, 255442)}, 1: {'measurement': 'humidity', 'unit': 'percent', 'value': 23.044174868390936, 'timestamp_utc': datetime.datetime(2022, 11, 17, 4, 21, 41, 255455)}, 2: {'measurement': 'dewpoint', 'unit': 'C', 'value': 5.007853460457261, 'timestamp_utc': datetime.datetime(2022, 11, 17, 4, 21, 41, 255483)}}
2022-11-17 11:21:56,278 - DEBUG - mycodo.controllers.controller_input_219db1e7 - Adding measurements to InfluxDB with ID 219db1e7-da4a-4023-9d83-88b43b4ce2cf: {0: {'measurement': 'temperature', 'unit': 'C', 'value': 28.06286717021439, 'timestamp_utc': datetime.datetime(2022, 11, 17, 4, 21, 56, 255774)}, 1: {'measurement': 'humidity', 'unit': 'percent', 'value': 22.801556420233464, 'timestamp_utc': datetime.datetime(2022, 11, 17, 4, 21, 56, 255803)}, 2: {'measurement': 'dewpoint', 'unit': 'C', 'value': 4.855827679937447, 'timestamp_utc': datetime.datetime(2022, 11, 17, 4, 21, 56, 255903)}}
2022-11-17 11:22:11,330 - DEBUG - mycodo.controllers.controller_input_219db1e7 - Adding measurements to InfluxDB with ID 219db1e7-da4a-4023-9d83-88b43b4ce2cf: {0: {'measurement': 'temperature', 'unit': 'C', 'value': 28.092240787365526, 'timestamp_utc': datetime.datetime(2022, 11, 17, 4, 22, 11, 305767)}, 1: {'measurement': 'humidity', 'unit': 'percent', 'value': 22.72983901731899, 'timestamp_utc': datetime.datetime(2022, 11, 17, 4, 22, 11, 305797)}, 2: {'measurement': 'dewpoint', 'unit': 'C', 'value': 4.835167484896004, 'timestamp_utc': datetime.datetime(2022, 11, 17, 4, 22, 11, 305898)}}
2022-11-17 11:22:26,285 - DEBUG - mycodo.controllers.controller_input_219db1e7 - Adding measurements to InfluxDB with ID 219db1e7-da4a-4023-9d83-88b43b4ce2cf: {0: {'measurement': 'temperature', 'unit': 'C', 'value': 28.10559243152514, 'timestamp_utc': datetime.datetime(2022, 11, 17, 4, 22, 26, 274346)}, 1: {'measurement': 'humidity', 'unit': 'percent', 'value': 22.6840619516289, 'timestamp_utc': datetime.datetime(2022, 11, 17, 4, 22, 26, 274358)}, 2: {'measurement': 'dewpoint', 'unit': 'C', 'value': 4.817394129880404, 'timestamp_utc': datetime.datetime(2022, 11, 17, 4, 22, 26, 274396)}}